This dashboard was used to monitor the Silicon Tracker detector subsystem for Compair Instrument. This interface was used in while developing the instrument so it was evolved as the need of the test demanded. You have 10 layers, and each layer has 192x2 detectors. The data is a mocked dummy data for display purposes.
Key Features
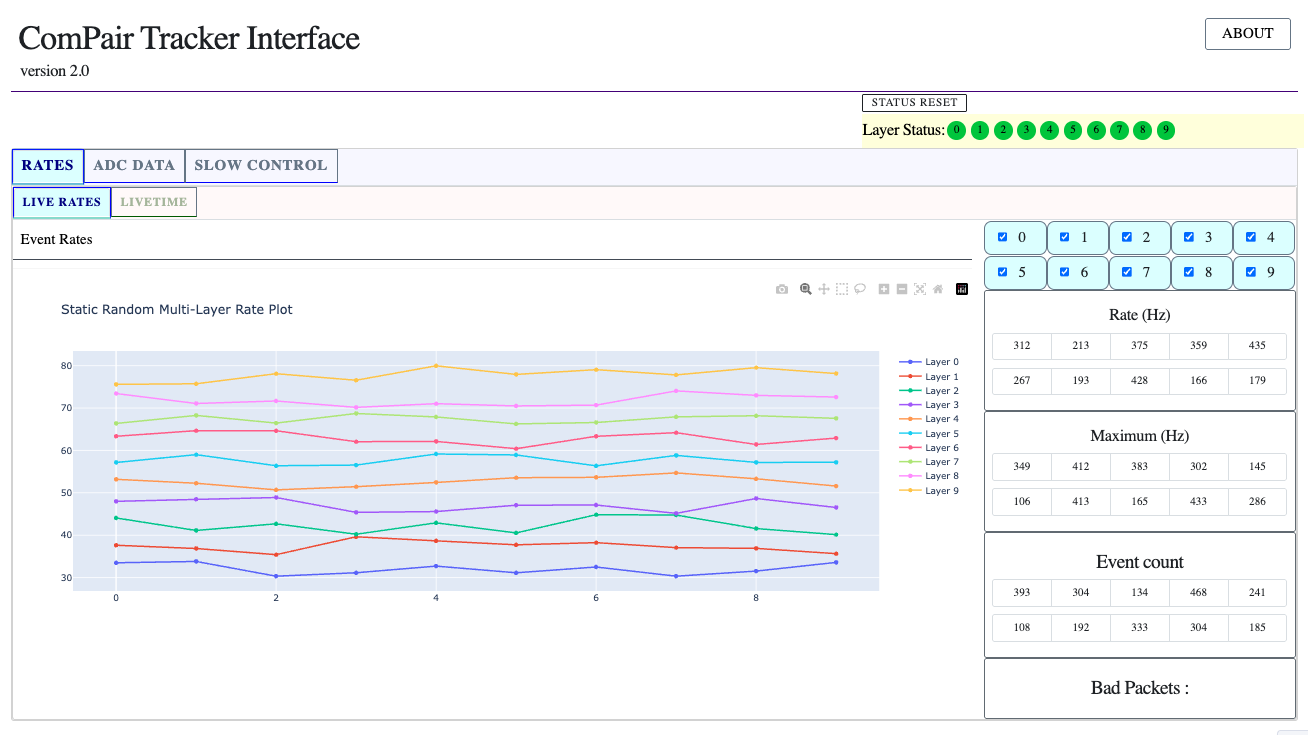
- Real-time detector data (Rates, Staus, Counts)
- Detector status, selection.
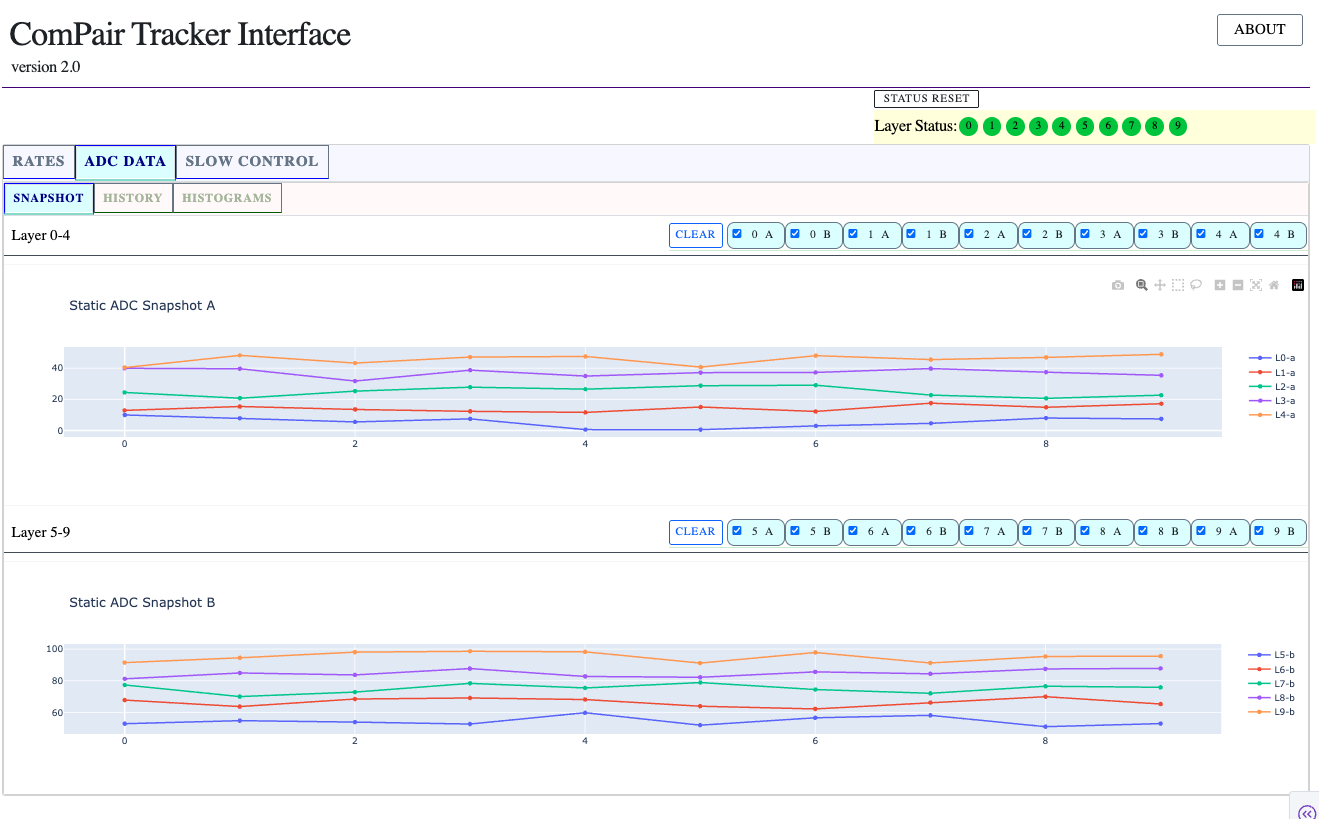
- Monitor 3840 individual detector snapshot, histogram and history.
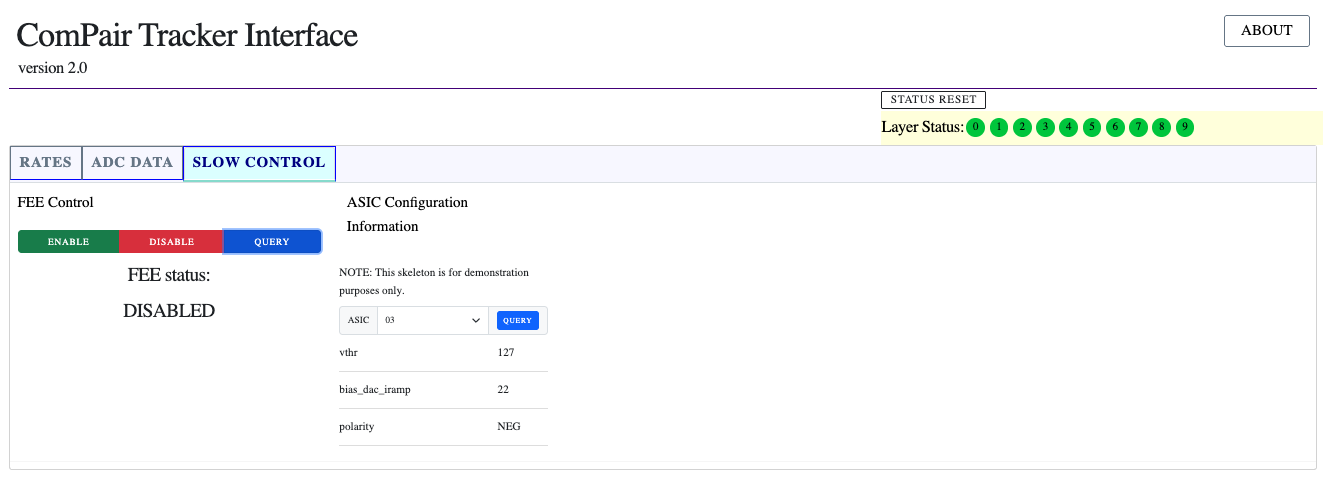
- Retrieve status and ASIC configuration.
- A Publisher-Subscriber, Request-Reply socket architecture
Detailed Overview
Compair was a balloon borne prototype (of AMEGO) that was designed for a balloon flight and it flew on fall of 2023 from Ft. Sumner, NM. It had 5 detector subsystems that covered medium MEV range and provided continuous sensitivity for Compton Scattering and Pair production detection. Typically, you would build detector using one of these mechanism therefore, the cross-section regions are low sensitivity.
The above realtime monitoring dashboard was designed for one of the subsystem, Silicon Tracker. It was Double Sided Silicon Detector (DSSD) which contains double 192 detectors aligned orthogonally and along with its electronics (FPGA, Digital Back End, Analog Front Ends) formed a layer. It had 10 layers. As you are building the detectors, being able to monitor the status, housekeeping and other aspects of the instrument response is crucial. So this project was started by monitoring just rates, then additional features were added as the needs of the project evovled. It could monitor rates, livetime and snapshots, history and histogram for each of the individual detectors (each of 384 (192x2) x 10 (layers) ). It also had the ability to grab configuration and other status as sometimes due to any error, any configuration change could completely give us wrong detection.
The monitoring software/dashboard was built on python, plotly-dash architecture with html, css and bootstraps. It used some javascripts for designs. Then ZMQ, sockets were used to stream in the data from detector susbsystem. The file structure and format was mostly binary raw level data from FPGA, detector and was parsed with our HDF5 format data when needed. This was only used in live time, for a thorough investigation and analysis, the full data file after the run was used.
Overall, it was a fun project and I got to learn different element of webpage designing, different way of communication between server and clients and understanding those aspects of architecture. I also learned the bottleneck and stress on the system when the realtime updates has to be fast.